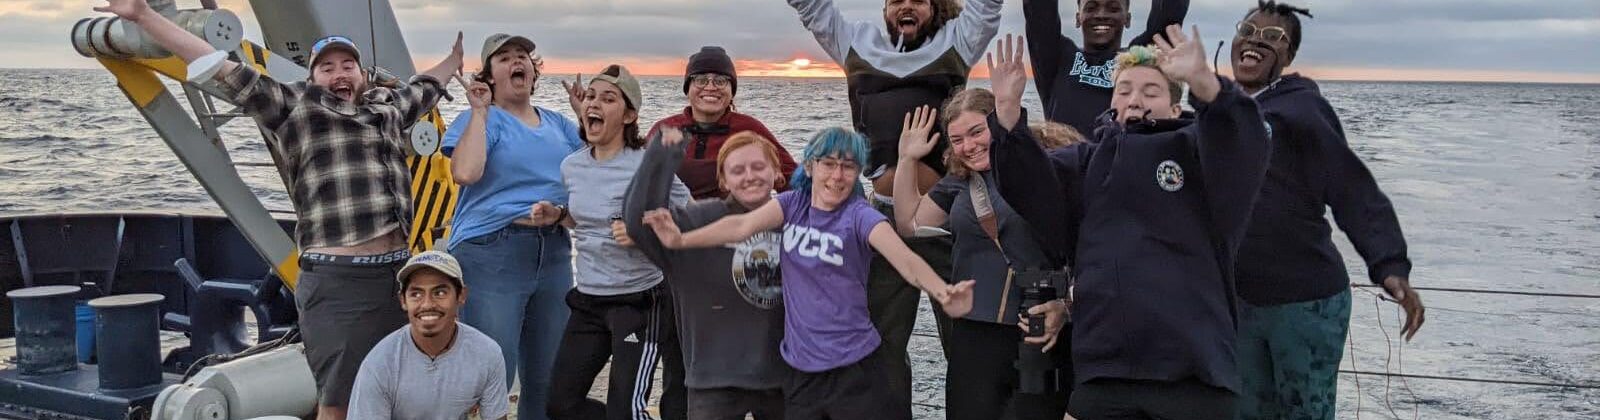
Day 7 of our 2YC faculty cruise! Today is our last full day on the Sally Ride, and it’s been a good one so far.
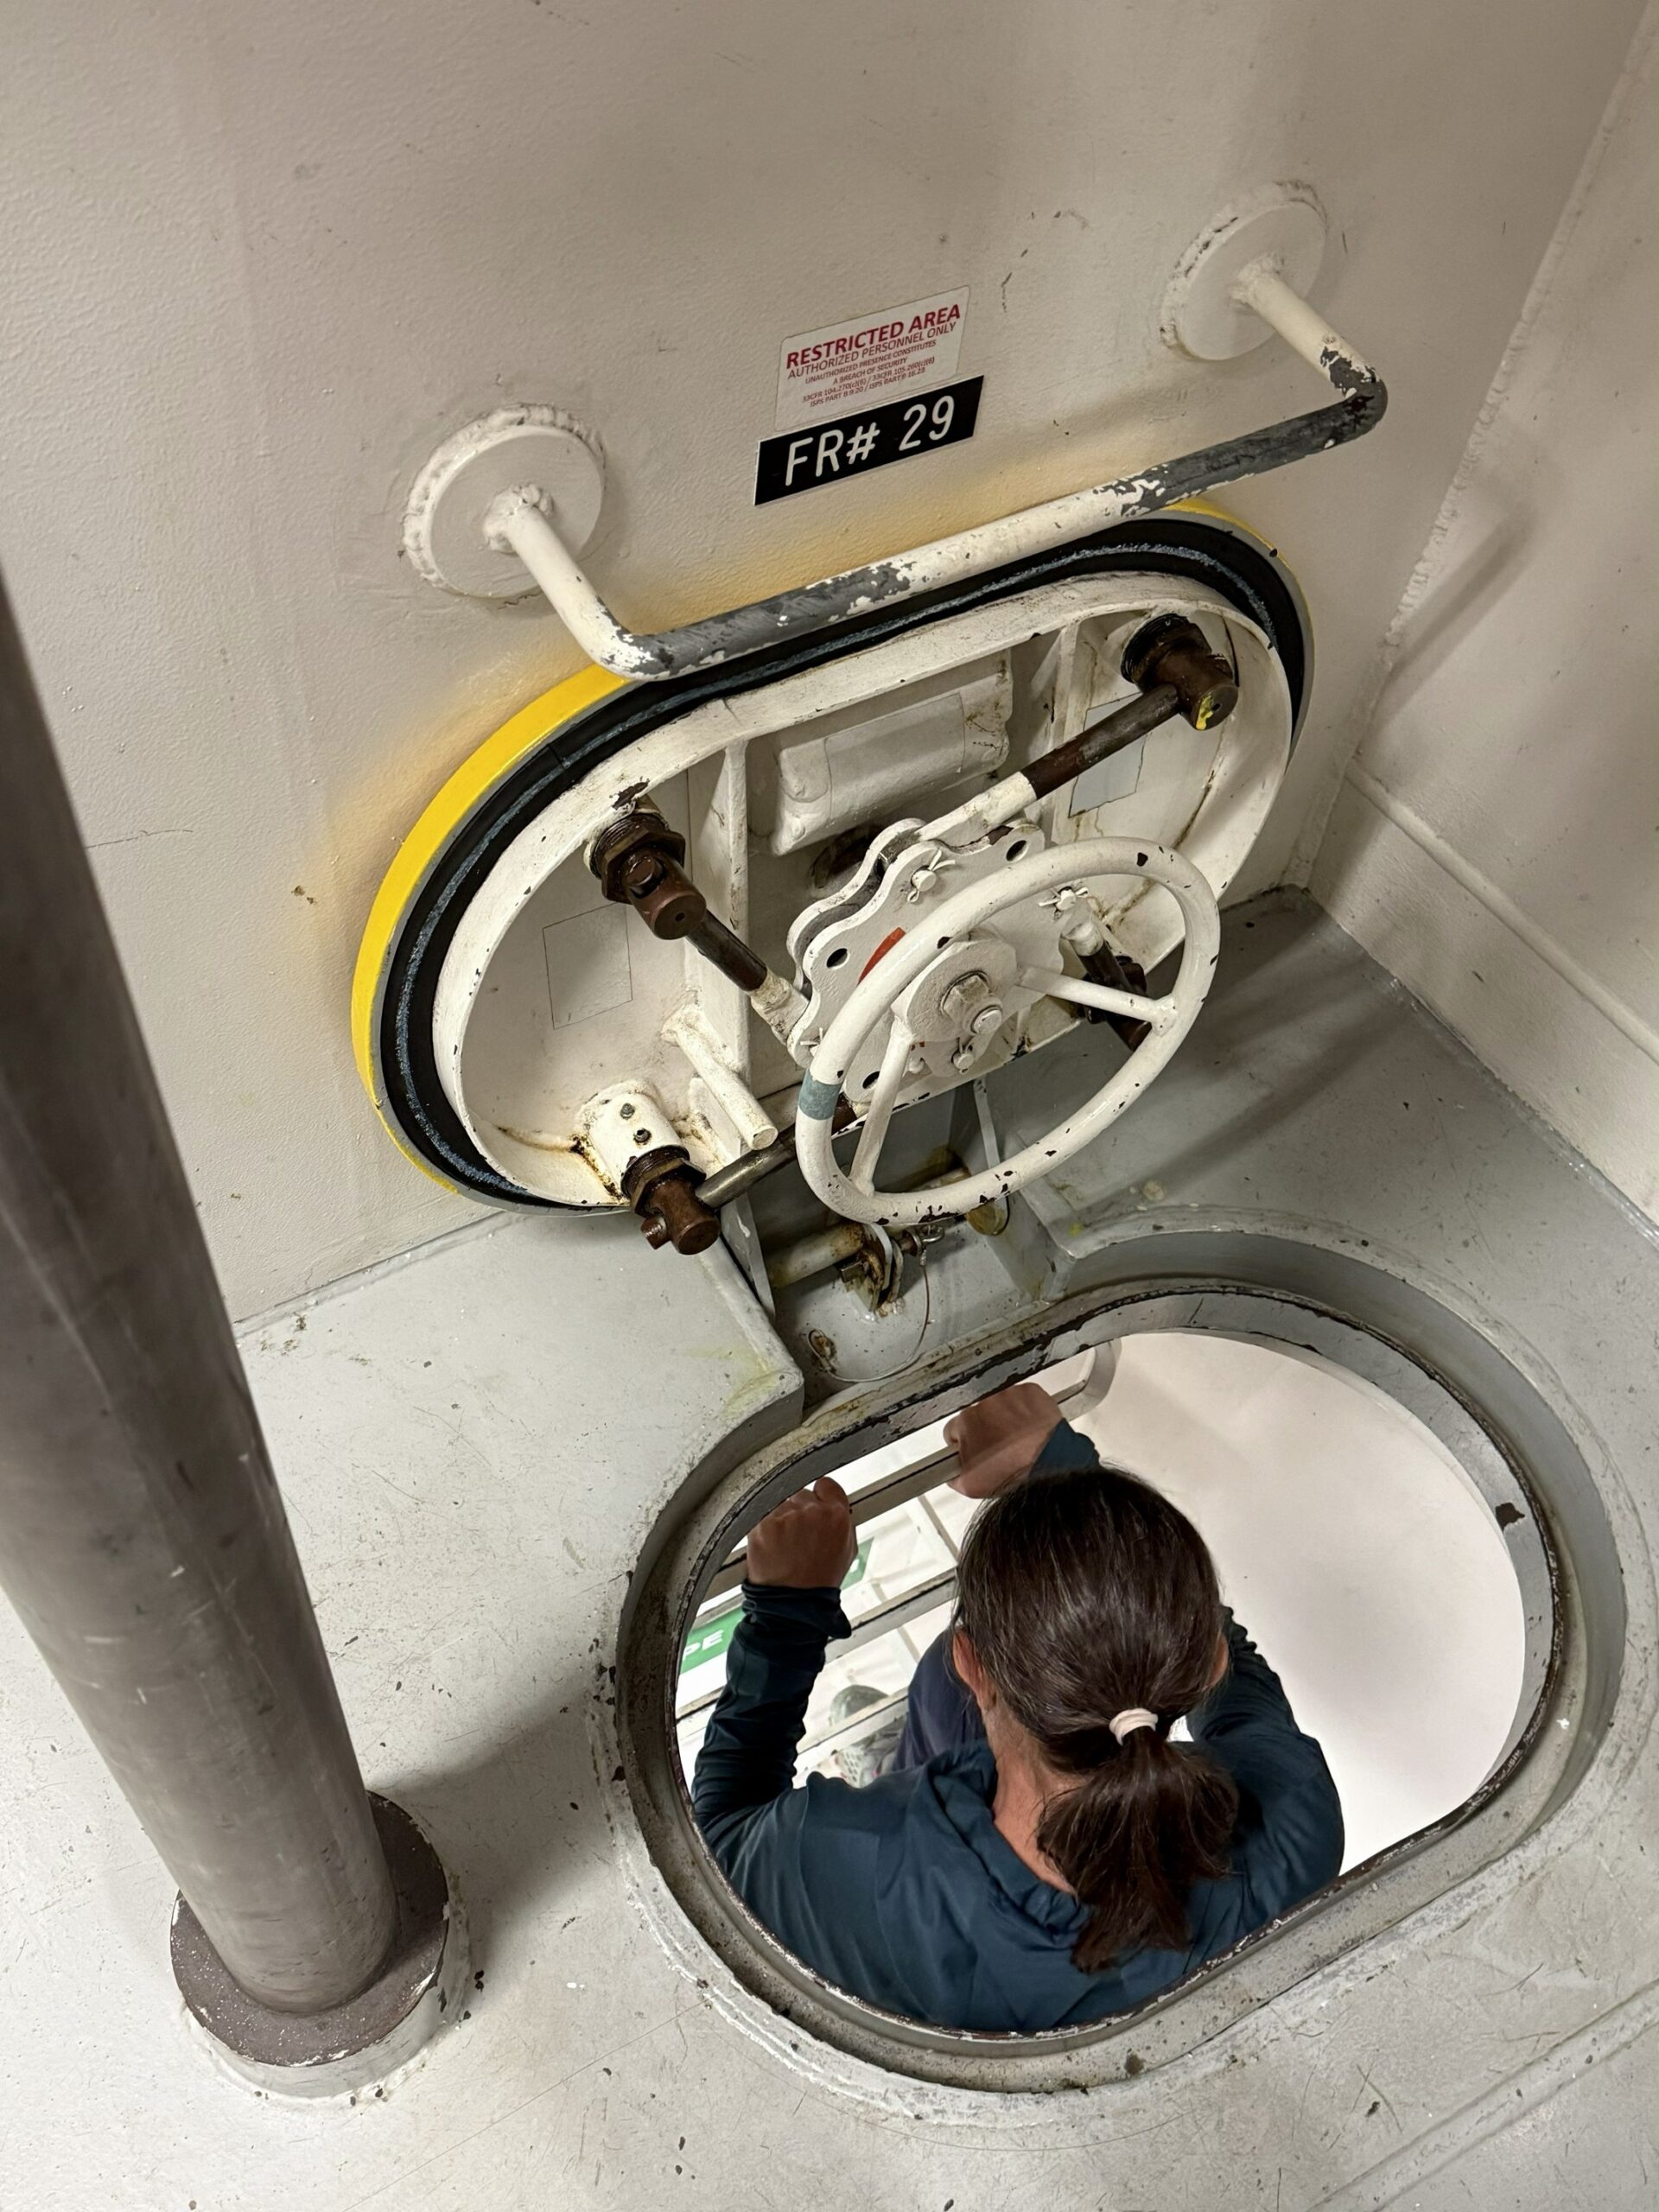
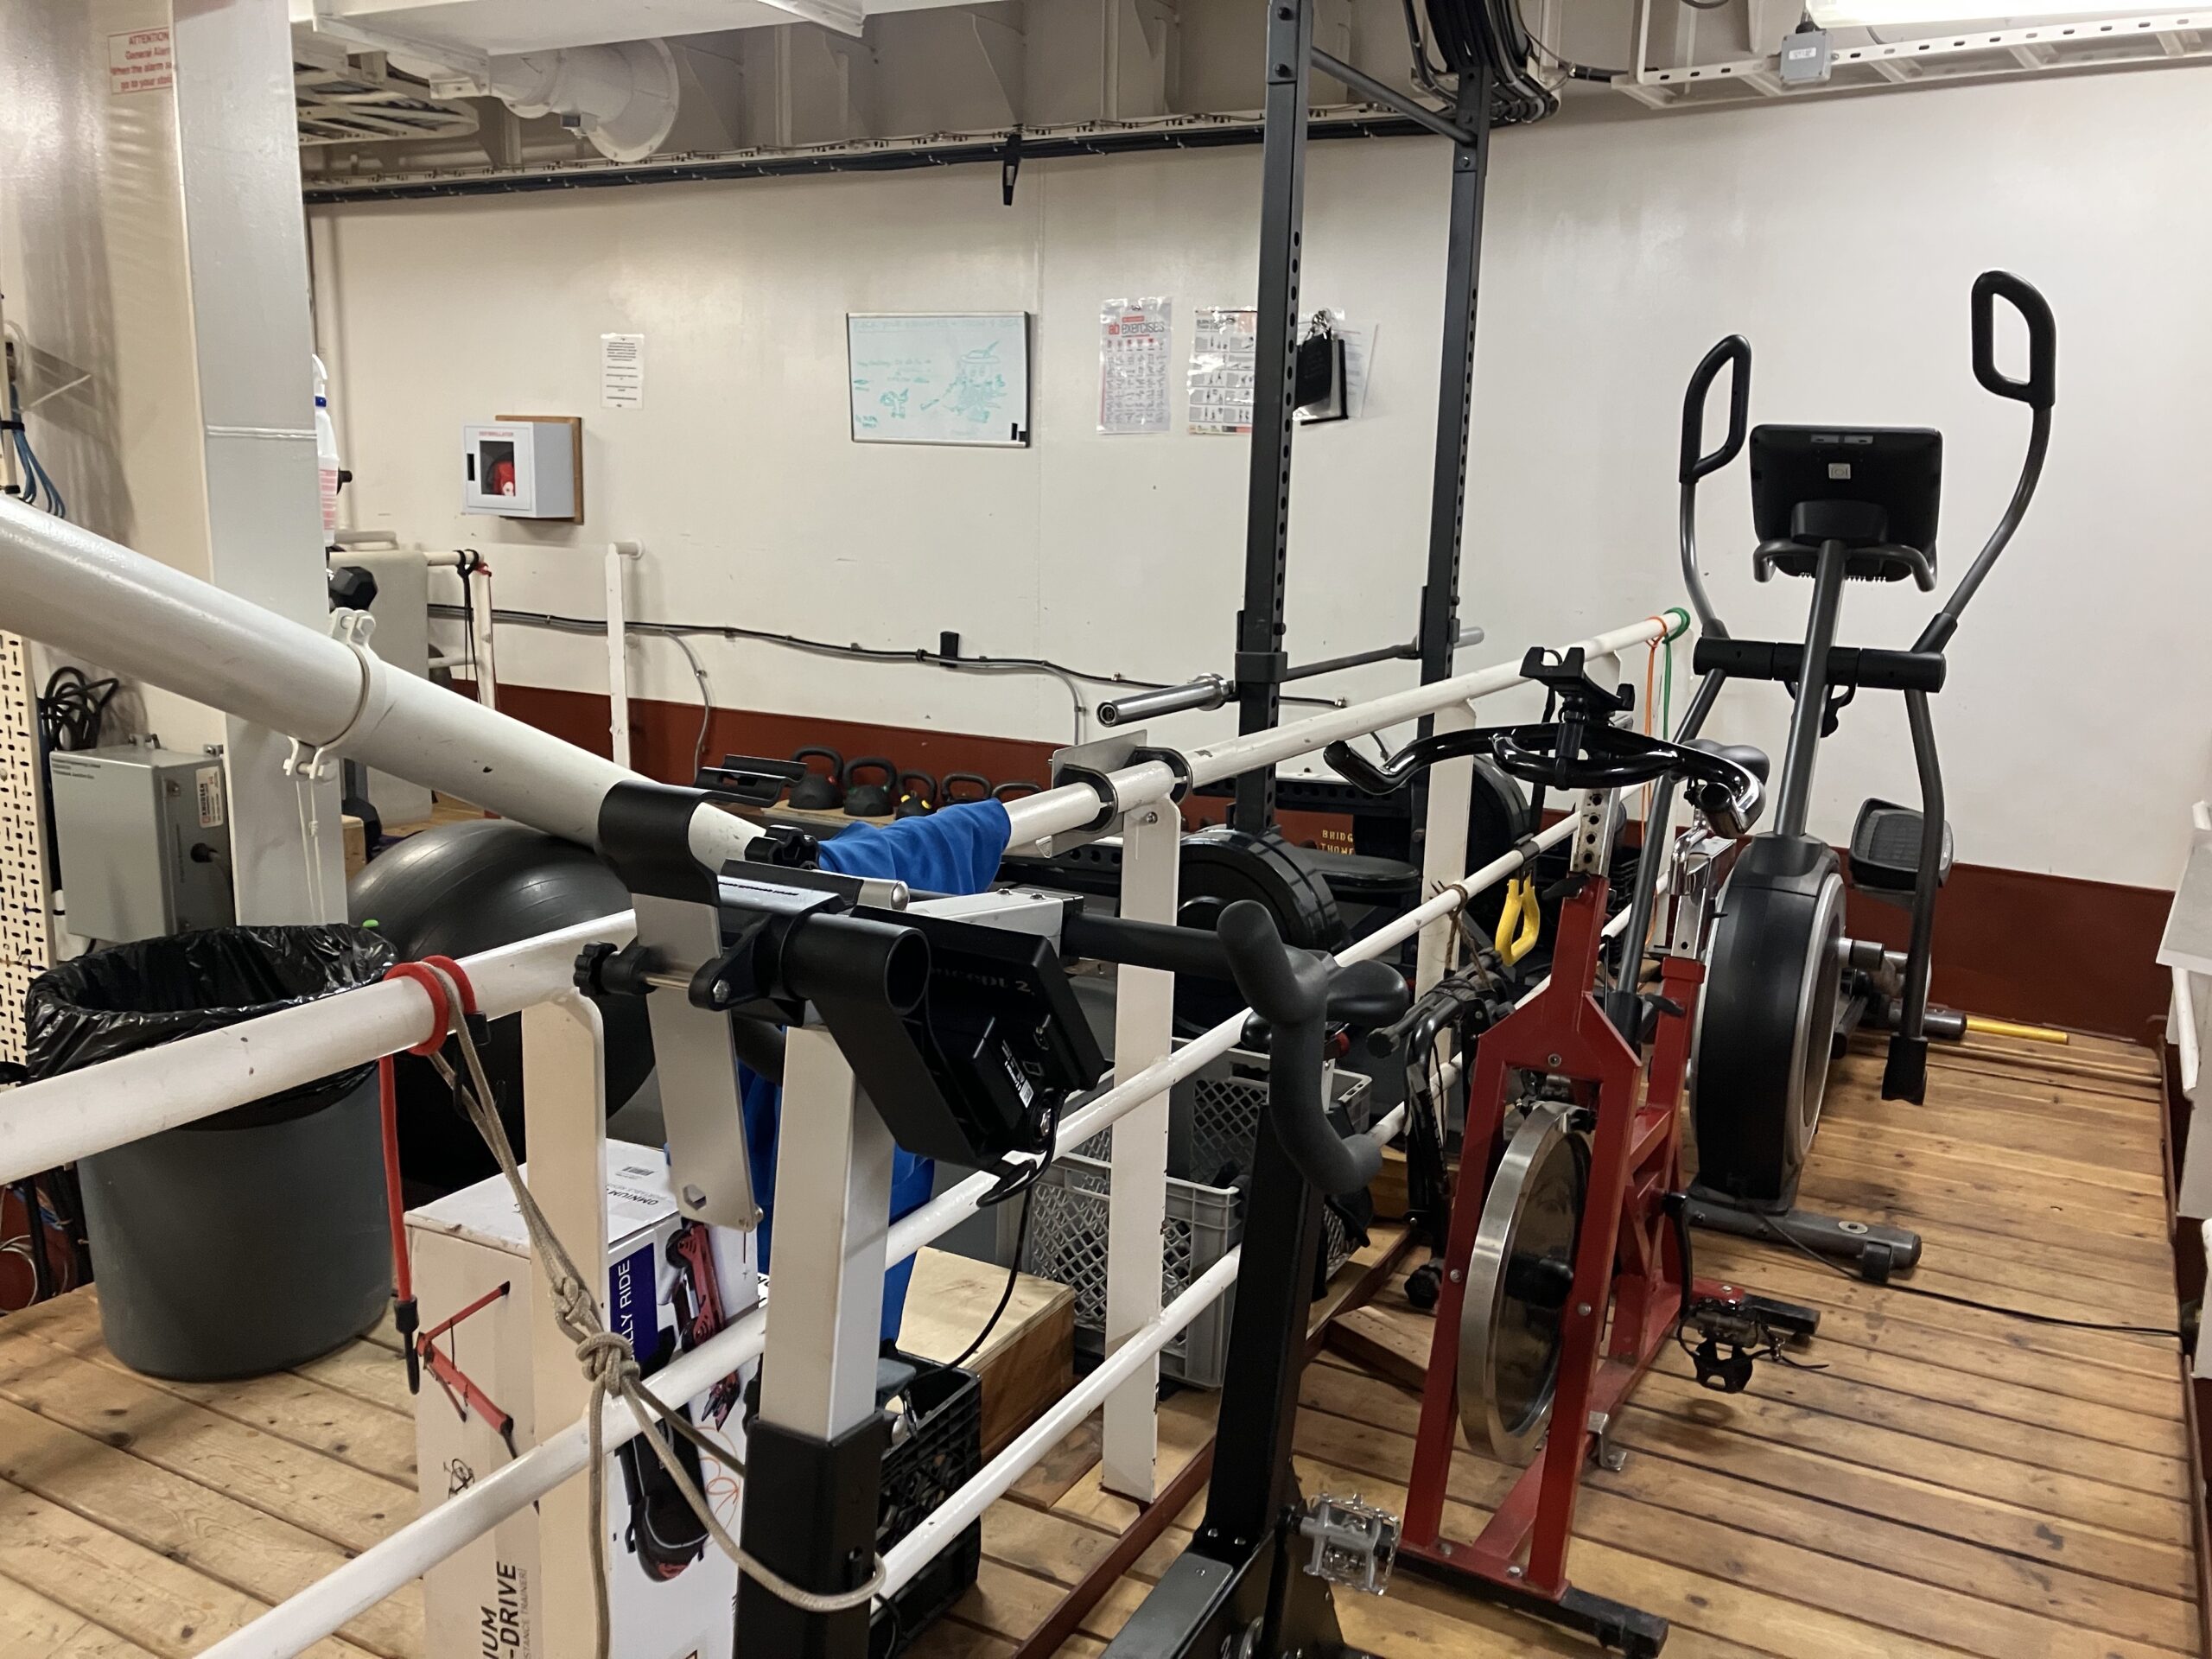
For me, the day started with an early, short visit to the ship’s gym. The gym may be the most booby-trapped gym I’ve ever visited. It requires a shimmy down an escape hatch to enter. The space itself has a few cardio machines and weights, arranged on catwalks above some of the ship’s scientific and mechanical instrumentation. Large pipes run through the room, and the floor steps up or down every few feet. A climbing wall decorates one wall (meant to be used while docked). Still, the presence of the gym is a nod to the fact that people live on the ship long-term, and that it’s crucial to take care of their mental and physical well-being.
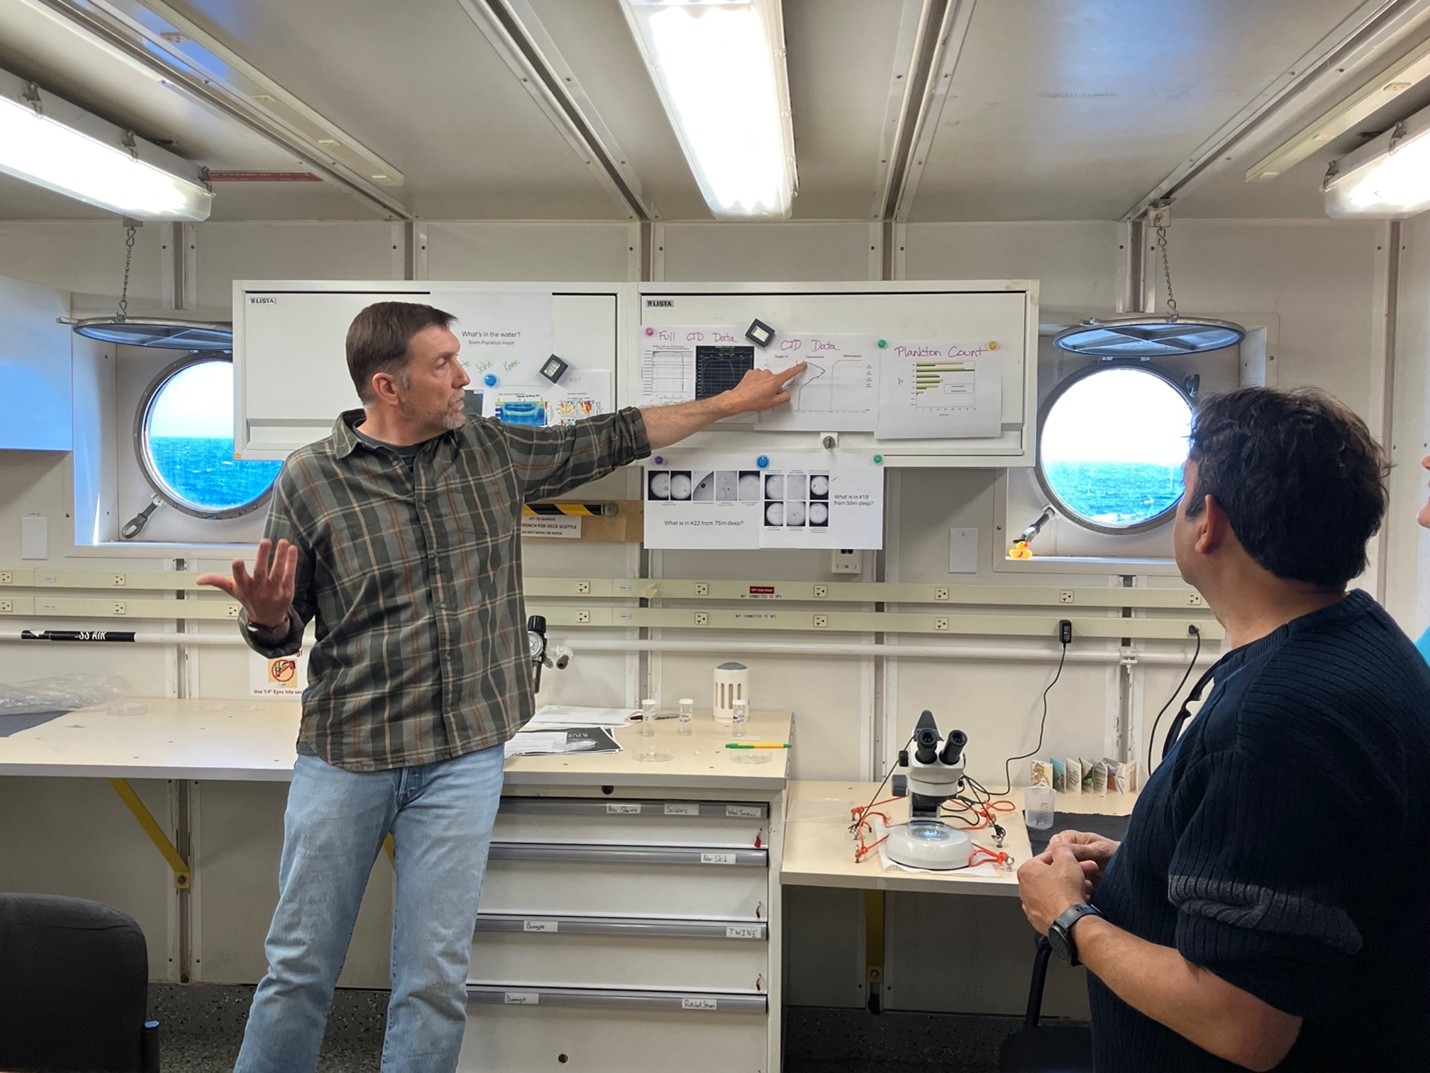
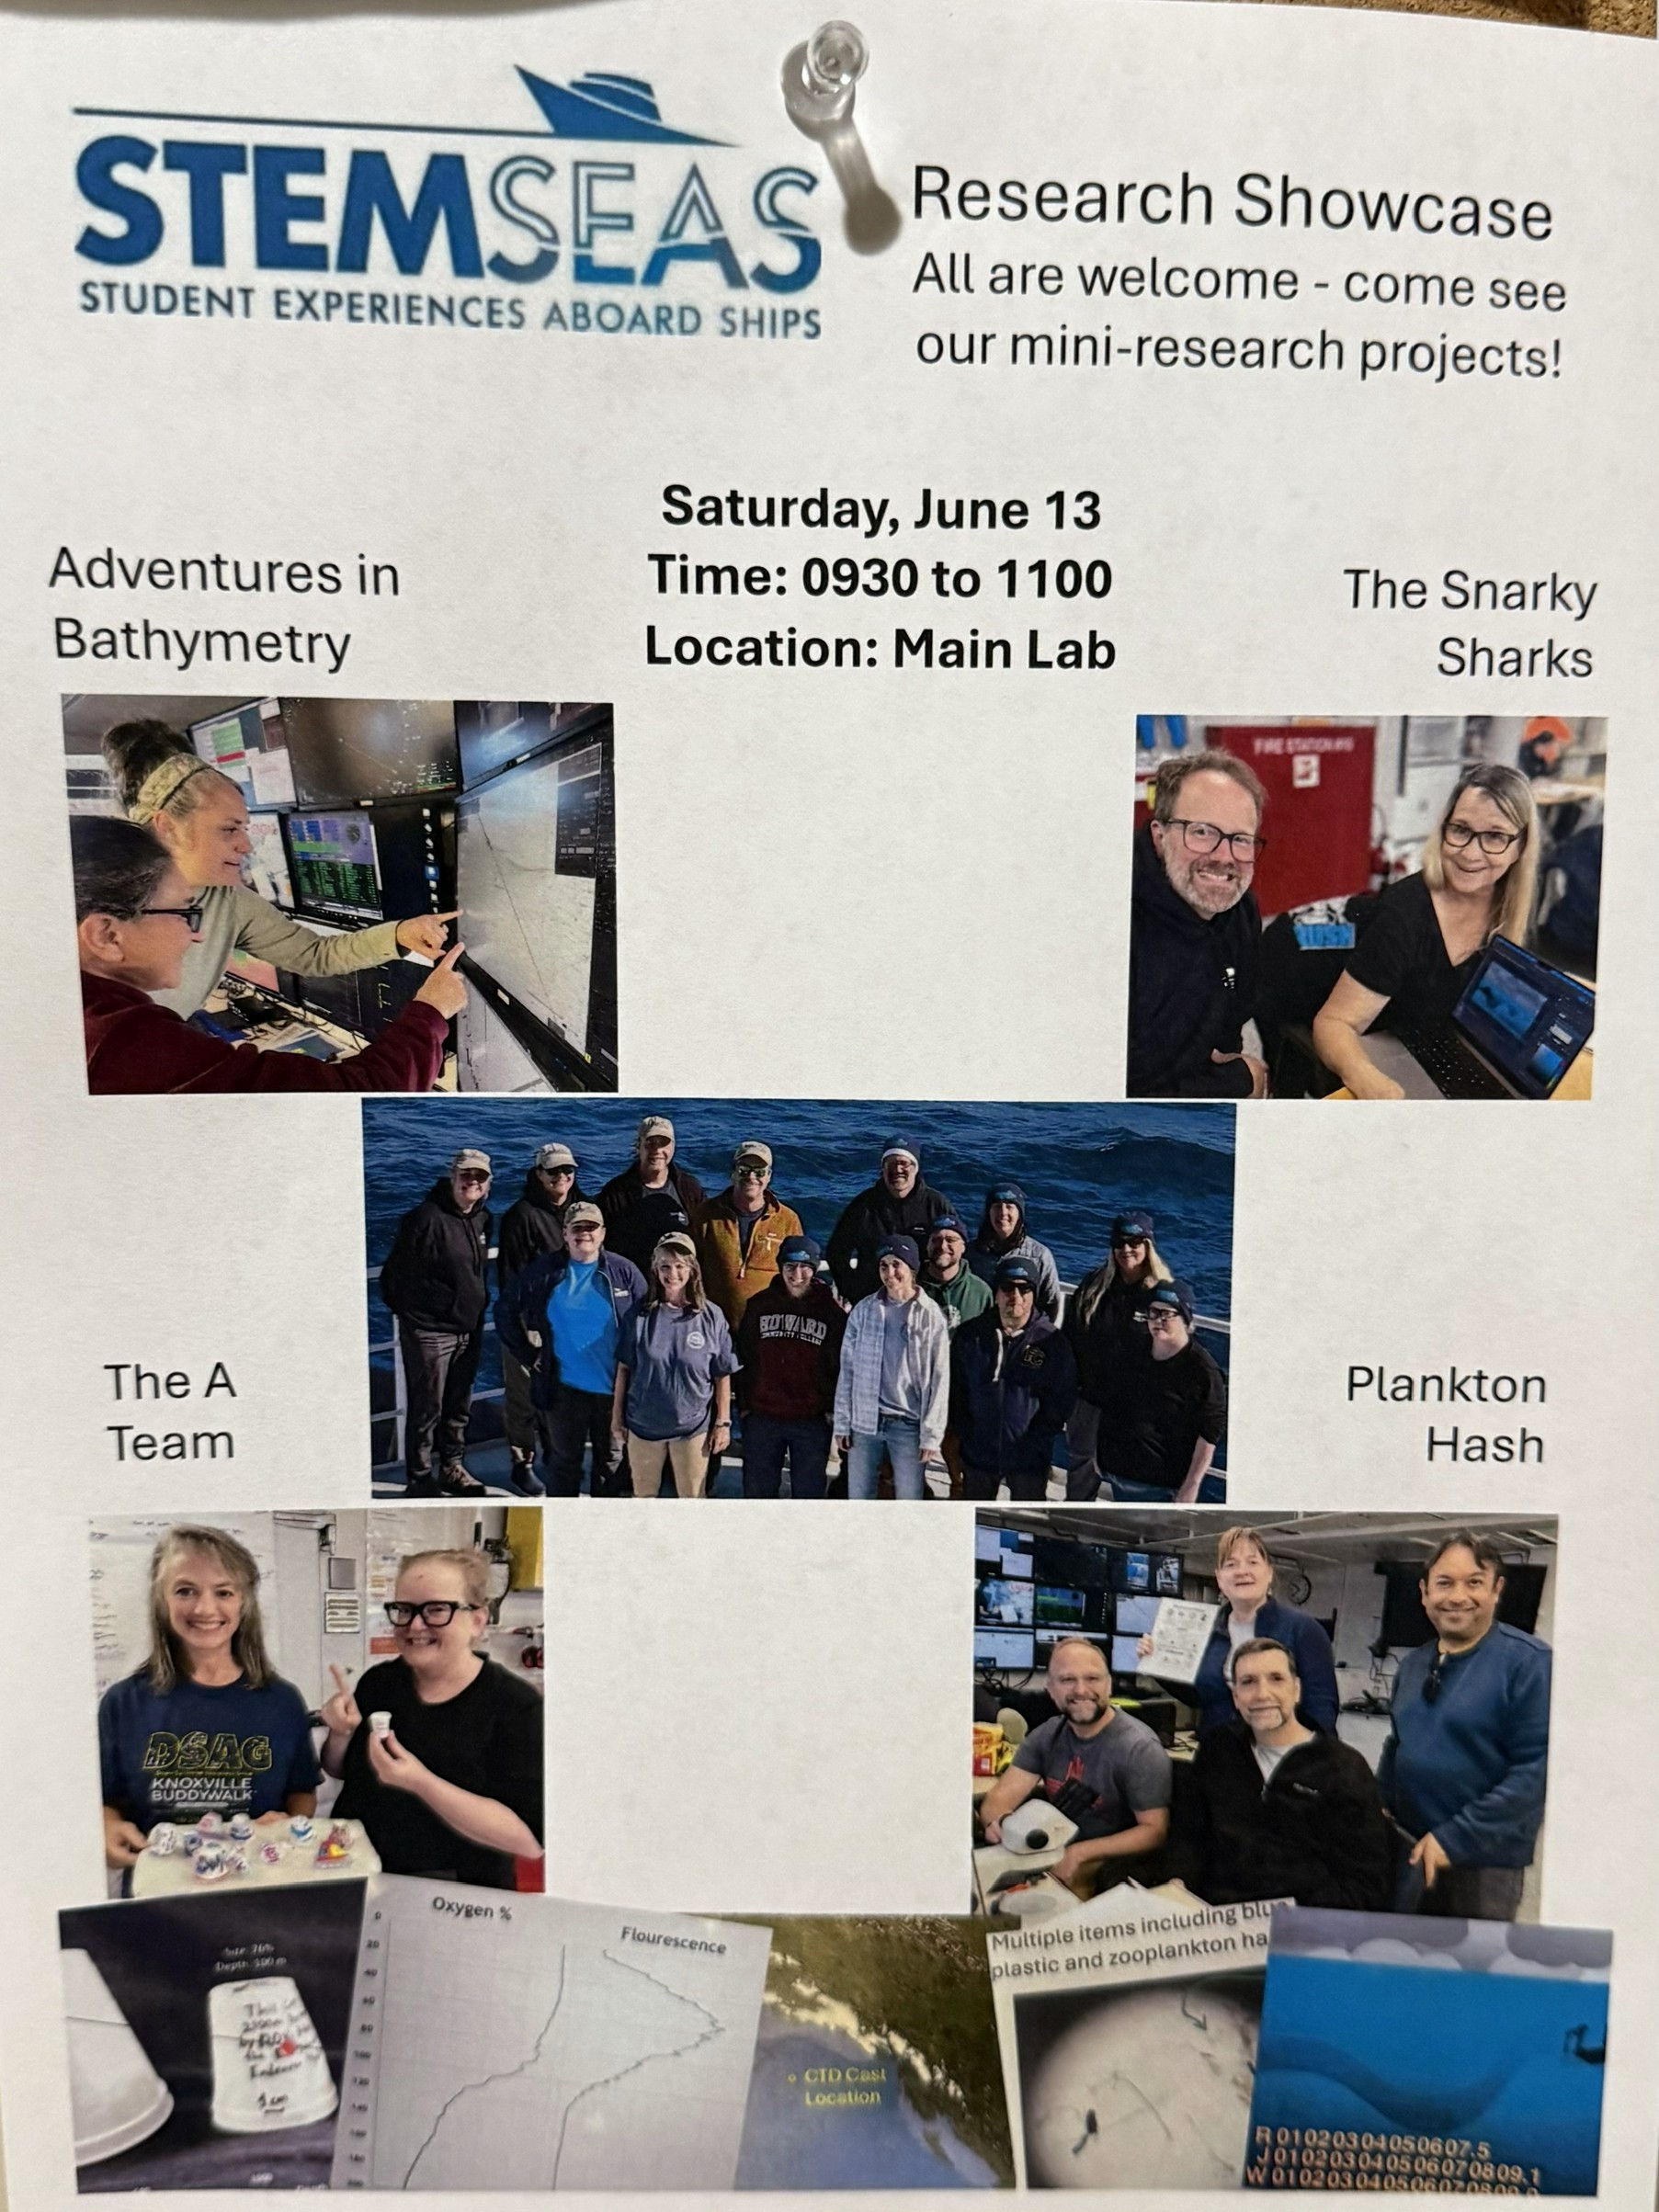
The real highlight of the day – even better than the glorious sunshine or delicious breakfast muffins – was getting to see the presentations on our research projects. Early in the cruise, we split into four groups, and each group devised a miniature research project that could be completed during our few days on the ship. The groups also came up with fun group names. This morning, each group gave a brief summary of their work. The presentations all sparked interesting follow-up questions and discussions. Team Plankton Hash compared the abundance of phytoplankton and zooplankton at different depths, using plankton collected with the CTD. Zooplankton were, surprisingly, more abundant in the upper level water, leading to questions about predation in the time between collection and sampling.
The Snarky Sharks group got very creative with an accessible project that measured wave period based on ship roll. Their results were impressively close to the Windy.com estimates of wave period. (Fun fact: The R/V Sally Ride contributes meteorological data to NOAA and to weather apps like Windy, as weather station WSAF!) The A Team made excellent use of our shrunken cups, measuring how the deep-sea compression changed their physical properties, and calculating the hydrostatic pressures required to drive those changes.
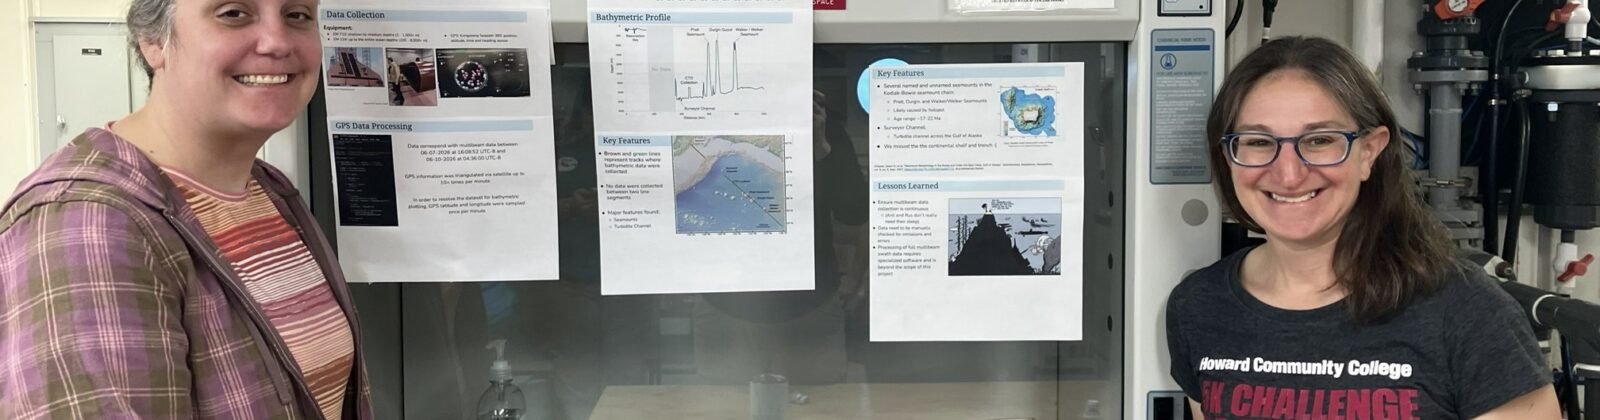
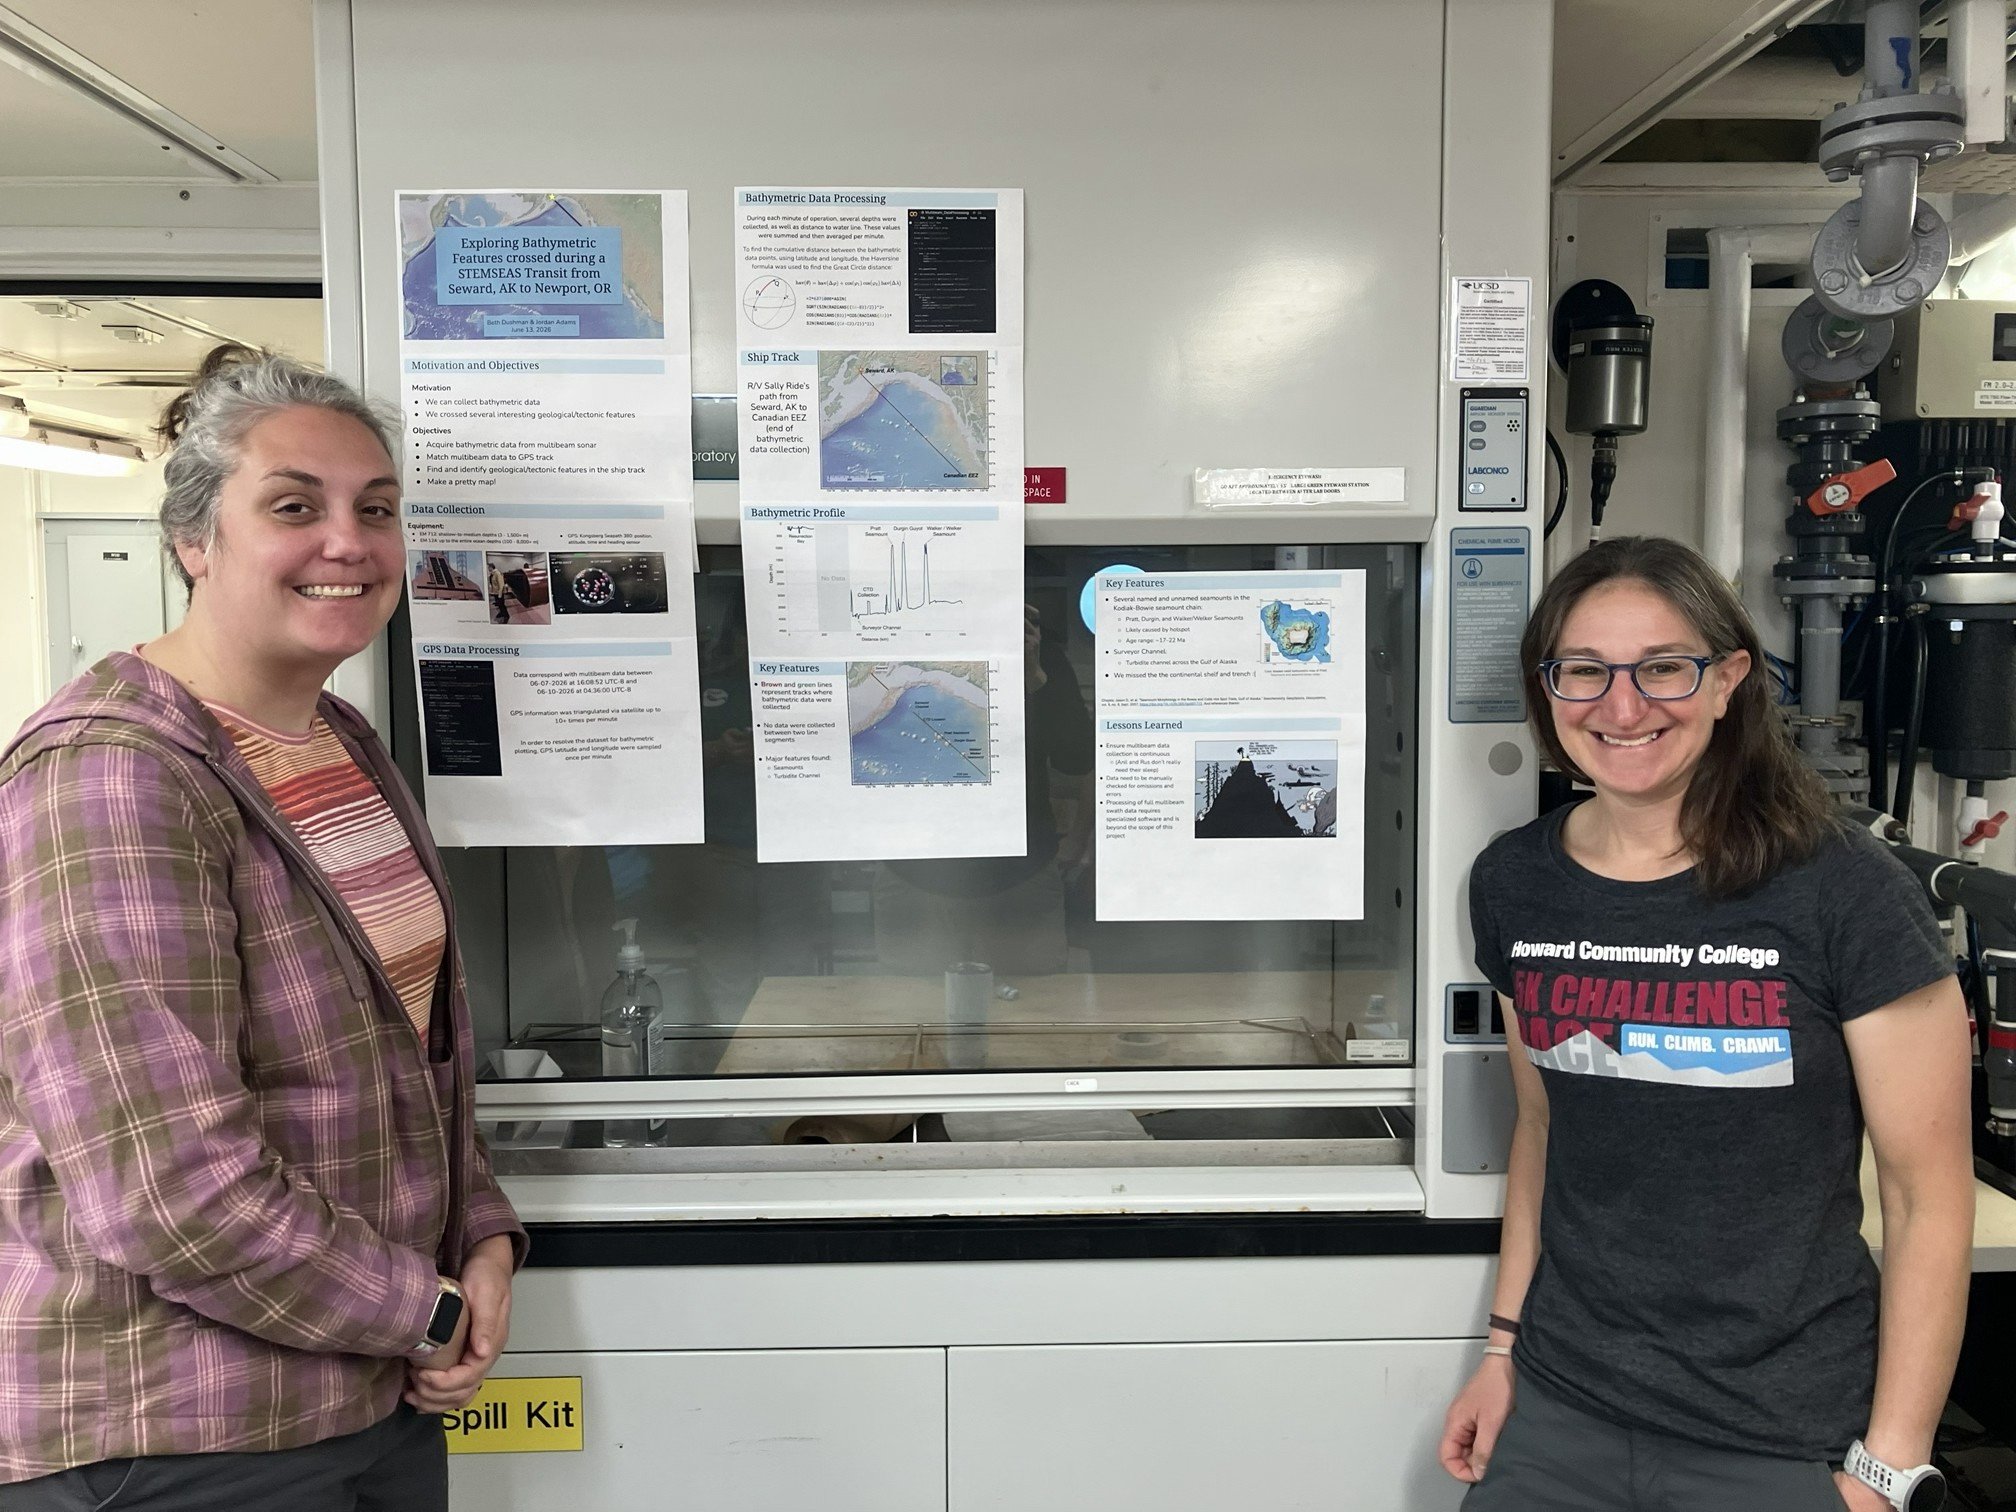
Lastly, Jordan Adams and I – Team Adventures in Bathymetry – paired up to use our bathymetric data to identify seafloor features. Bathymetry is the measurement of the depth of the ocean, and the data are collected using an instrument called multibeam sonar. While we didn’t have the time or software to process all of the data, we could create a topographic profile under the ship’s path, using data processed with Jordan’s amazing Python coding skills. There were a few bumps: We were heartbroken to learn that the multibeam sonar was turned off as we crossed the plate boundary from the North American Plate to the Pacific Plate, as the chirping of the multibeam sonar can be heard in some of the berths. We also had to stop collecting data when we crossed into the Canadian Exclusive Economic Zone, as we did not have a permit for data collection there. Despite these data gaps, we were able to see some exciting seafloor features, including a long erosional channel and several extinct underwater volcanoes, called seamounts.
Originally, I didn’t think that the research projects were going to be my favorite part of the trip so far, but doing this project has rekindled my love for doing science, something I don’t always get to do in my teaching job. Working as a team with diverse but complimentary skills to analyze the data and create a final product was fun and gratifying. This experience could be revolutionary for a STEMSEAS student, who might otherwise never get a chance to do this kind of hands-on research project in their regular course work. The passion, creativity, and sense of humor that my cohort brought to these projects will continue to inspire me long after we dock in Newport tomorrow.